
Texas Commercial Electricity Pricing vs. GDP: What 24 Years of Data Actually Shows
When the economy slows, should commercial energy buyers expect prices to fall? The data says no — and understanding why matters for anyone making a contract decision right now.
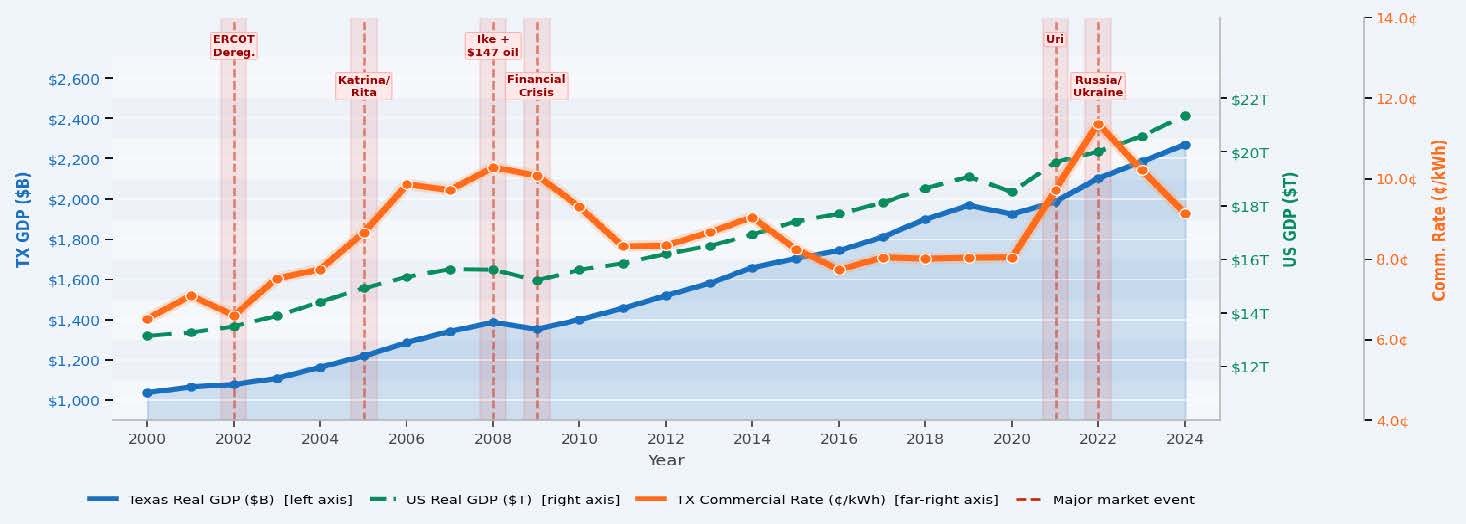
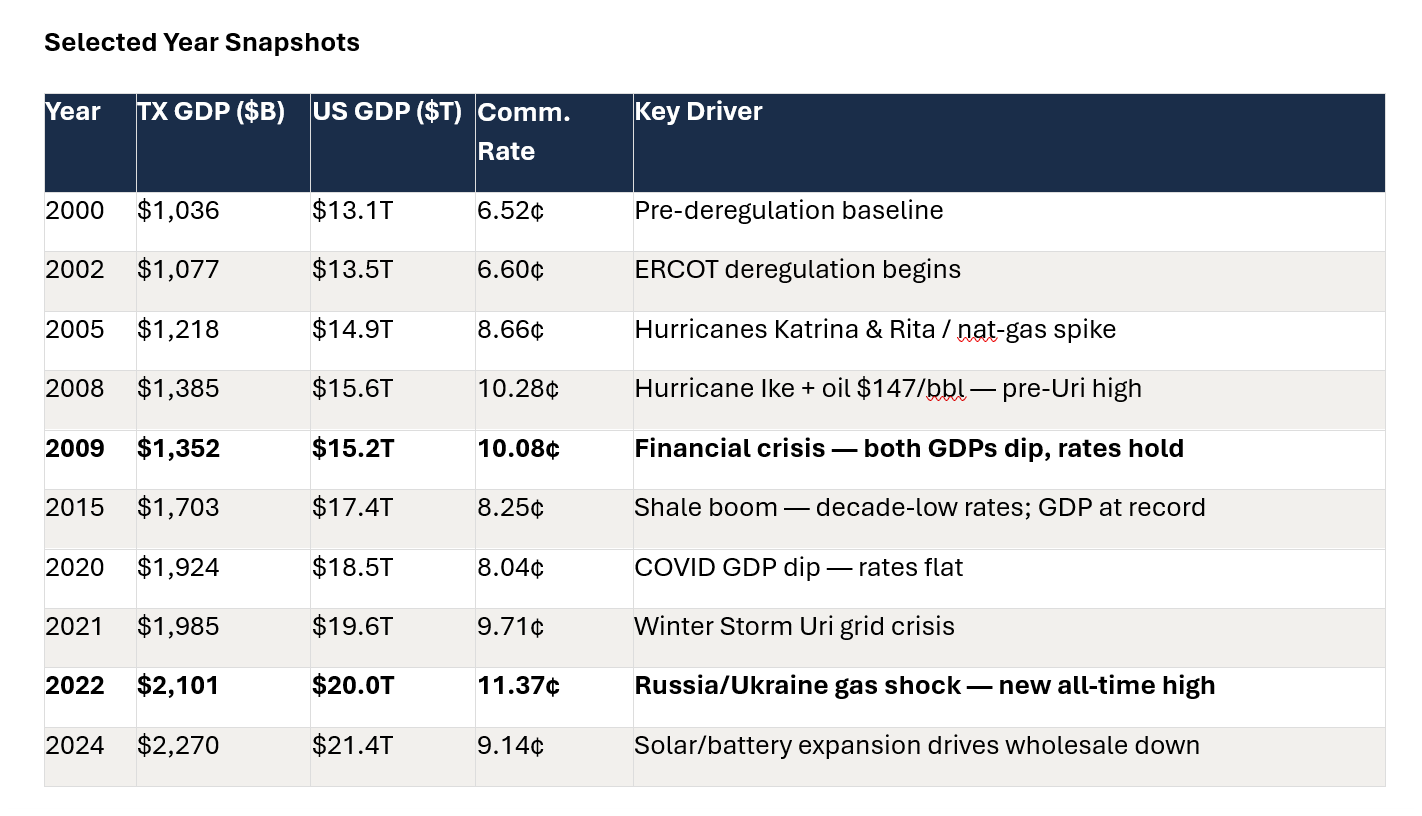
We analyzed 24 years of Texas commercial electricity rates against both U.S. and Texas GDP — every year from 2000 through 2024. The conclusion is unambiguous: there is no meaningful correlation between economic growth and commercial electricity pricing in Texas. Both Texas and U.S. GDP grew nearly every year over this period. Commercial electricity rates moved independently — driven by fuel costs, weather events, and grid crises, not economic cycles. Here's what the data shows, year by year.
2008–09 Financial Crisis: The Clearest Proof
The 2008–09 financial crisis is the single best case study. Both Texas and U.S. GDP contracted in 2009 — one of the sharpest economic downturns in modern history. Commercial electricity rates barely moved. The 2008 pricing peak wasn't caused by economic expansion — it was Hurricane Ike hitting the Gulf Coast in September 2008 combined with natural gas at $13/MMBtu. The subsequent rate decline had nothing to do with the recession. It was the U.S. shale gas boom flooding the market with supply. GDP went down. Electricity prices didn't follow. Then GDP recovered and grew for years. Electricity prices kept falling — because shale gas kept producing.

The Structural Change That Ends the Low-Rate Era
The Russia/Ukraine shock in 2022 pushed Texas commercial rates to a new all-time high of 11.37¢/kWh. More importantly, it revealed a structural change in the U.S. gas market that had been building since 2016: LNG export terminals. U.S. liquefied natural gas now competes directly with domestic buyers for the same gas supply. European buyers scrambling for alternatives to Russian gas sent Henry Hub prices to $8–9/MMBtu — the highest since 2008. This isn't a temporary dislocation. The LNG export infrastructure is permanent. It means there is now a structural floor under U.S. natural gas prices that simply didn't exist during the 2014–2020 low-rate era. The extended period of sub-$3/MMBtu gas that enabled electricity rates below 8¢/kWh is unlikely to repeat.
The Contract Timing Takeaway
The Shale Boom: What Actually Drove the Decade of Low Rates
Between 2008 and 2016, Texas commercial electricity rates fell from 10.28¢/kWh to around 8¢ — a meaningful decline. During that same period, both Texas and U.S. GDP grew every single year. The rate decline had nothing to do with economic conditions. It was entirely a supply-side story: the Permian Basin, Eagle Ford, and Haynesville shale formations unlocked gas volumes the market hadn't anticipated. More supply, same demand, lower prices. The decade of low rates from roughly 2014 through 2020 was a product of unprecedented domestic gas production — not a weak economy.

What's Coming: Structural Upward Pressure
By 2024, solar and battery expansion had pushed wholesale prices back down — Texas commercial rates pulled back to 9.14¢/kWh from the 2022 peak. But the forward picture carries meaningful structural upward pressure: ERCOT forecasts 50% demand growth by 2029, driven primarily by data center expansion, crypto mining operations, and continued industrial growth. Approximately $32 billion in transmission and distribution infrastructure costs have already been approved by the PUCT for recovery through 2032, with analysts projecting roughly 29% additional T&D cost growth by 2030. Those costs flow through to commercial ratepayers regardless of what happens to fuel prices. The implication for buyers: renewable and storage expansion will continue to suppress daytime wholesale prices and provide some offset. But infrastructure costs and LNG-driven gas price floors mean the structural tailwinds that drove the 2008–2020 rate decline are gone.
If you're waiting for an economic slowdown to bring electricity prices down before locking a contract, the data suggests you're watching the wrong signal. The economy doesn't drive ERCOT pricing. Natural gas supply and demand does — specifically weather, storage levels, renewable displacement, and geopolitical events affecting LNG markets. The right signals to watch before making a contract timing decision are the EIA weekly natural gas storage report, Henry Hub forward curve momentum, near-term weather forecasts for Texas, and where you are in the seasonal calendar. A softening GDP number tells you almost nothing about what your next electricity contract is going to cost. That's the framework we've been using for 15 years. The data backs it up.
*Sources: U.S. Bureau of Economic Analysis (BEA) real GDP, chained 2017$; EIA Electric Sales, Revenue & Average Price (Form 861), Texas commercial sector; EIA Short-Term Energy Outlook; ERCOT Capacity, Demand & Reserves Reports; PUC of Texas market rule filings.*